Dundee Private Investors Inc. Financial Advisors
of London Ontario Blog

We are a group of independent financial advisors in London Ontario with Dundee Private Investors Inc.We created this page to be your information source to keep you up to date on current market conditions, new products, changes to the tax laws and general investment basics.

Thursday, February 5, 2009

2009 Federal Budget Highlights


On January 27, 2009, Federal Finance Minister Jim Flaherty presented the government’s budget for 2009, entitled Canada’s Economic Action Plan. The stated goals of the budget are to stimulate economic growth, support Canadians and invest in Canada’s long-term growth. Considering the current state of the global and domestic economies, it comes as no surprise that the proposed measures are predominantly directed towards economic stimulus. Nevertheless, there are a number of changes which will be relevant at a personal level and which, taken together, provide modest tax relief.

Non-Refundable Tax Credits1
• The basic personal amount, spousal and common-law partner amount and eligible dependant amount increase to $10,320.
• The upper thresholds for the two lowest income tax brackets increase to $40,726 and $81,452, respectively, with no change in the applicable tax rates.
• The age amount for seniors aged 65 or older increases to $6,408, and the income level at which the age amount is fully phased out increases to $75,032. 1 Indexed for inflation in subsequent years.

RRSP/RRIF Losses after Death
• In the event of losses in an RRSP or RRIF following death but before distribution of proceeds to beneficiaries, the losses can be carried back and deducted against RRSP or RRIF income for the year of death.

Homeowners and Home Buyers
• Homeowners may claim a home renovation tax credit on their 2009 tax return of up to 15% of eligible renovation costs incurred between January 27, 2009 and February 1, 2010. This non-refundable tax credit applies to the portion of renovation costs exceeding $1,000 and up to $10,000, for a maximum credit of $1,350 per family. This credit is in addition to other grants and tax credits which may be available, such as the ecoENERGY retrofit program.
• The withdrawal limit under the Home Buyers’ Plan increases to allow up to $25,000 to be withdrawn from a RRSP, an increase of $5,000.
• First-time home buyers may also claim a non-refundable $5,000 tax credit on the purchase of a qualifying home. Individuals eligible for the disability tax credit may also claim this amount if the home purchase improves accessibility or is better suited to the needs and care of the disabled person.


Mineral Exploration Tax Credit
• Eligibility is extended by one year for flow-through share agreements entered into before April 1, 2010.

The information contained in this publication was obtained from sources believed to be reliable; however, DundeeWealth Inc., its affiliates, directors, officers, and officers or directors of its affiliates cannot guarantee its accuracy or completeness. This publication is for informational purposes only and should not solely be relied upon. Please consult your professional tax or legal advisor for advice related to your specific situation.

Friday, January 9, 2009

Wednesday, January 7, 2009

Seizing Opportunity in Adversity

Article provided by Invesco Trimark. Written August 2008

Remaining Focused In Today’s Market Environment
In periods of market volatility, a look at history may offer insights into the benefits of long-term investing.
Suppose you placed a hypothetical C$10,000 investment in the
Standard & Poor’s (S&P) 500 Index at the top of the stock market on January 1, 1973. By October 3, 1974, the market bottom, your investment would have dropped in value to $5,562 – a decrease of approximately 44%.

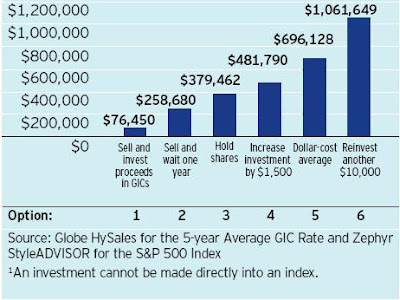
Hypothetical C$10,000 Investment
In the S&P 500 Index1
January 1, 1979 - October 3, 1974


How would you have reacted?
1 Sell your shares and put the proceeds into a Guaranteed Investment Certificate (GIC).
2 Sell your shares and wait one year before reinvesting.
3 Hold on to your shares (remain invested).
4 Increase your investment by $1,500.
5 Dollar-cost average $1,000 a year for the next 10 years.
6 Reinvest another $10,000.


Continue Reading to see which option outpreformed.

Committed investors should stay the course
When the market plunged in the ‘70s, savvy investors knew that the down times wouldn’t last forever. They looked beyond the loss to see an opportunity for long-term potential gains. While some investors jump at the first signs of trouble, others know they have time on their side. If you’re concerned about market volatility, seek the combined expertise of your advisor and the investment management of Invesco Trimark.

Growth of hypothetical C$ 10,000
Investment in the S&P500 index1
Dollar values from October 3, 1974(as at December 31 2007)


Following the 1973–74 downturn, the investments of dedicated investors increased
more than those who pulled their funds from the market.


Number of years to regain original C$ 10,000
Investment in the S&P 500 Index1
Years from market bottom of October 2, 1974
(as at December 21, 2007)

It took investors who remained committed to their longterm goals less time to recover their
investment than those who fled the stock market.


Globe HySales 5-year Average GIC rate is a calculated index, derived by using the month-end 5-year Trust Company GIC rate as provided by the Bank of Canada. The rate assumes monthly reinvestments of interest and capital and should not be considered as the actual return of an investment in a 5-year GIC. The information provided is general in nature and is provided with the understanding that it may not be relied upon as, nor considered to be, the rendering of tax, legal, accounting or professional advice. Readers should consult with their own accountants and/or lawyers for advice on the specific circumstances before taking any action.
Commissions, trailing commissions, management fees and expenses may all be associated with mutual fund investments. Mutual funds are not guaranteed, their values change frequently and past performance may not be repeated. Please read the prospectus before investing. Copies are available from your advisor or from Invesco Trimark.
* Invesco and all associated trademarks are trademarks of Invesco Holding Company Limited, used
under licence. Trimark and all associated trademarks are trademarks of Invesco Trimark Ltd.
© Invesco Trimark Ltd., 2008
ISSOIAE(08/08)

Tuesday, November 11, 2008

30 years of Time Magazine Covers & The Stock Market

From January 1978 to August 2008

Source: National Bank Advisor Distribution
Date Authored: August 8, 2008

At times like this, that is, times of declining stock markets prompted by an economic downturn and/or recession, the media play a significant role in creating fear in the minds of investors. Unfortunately, they are so successful at doing this that many investors are driven to make the wrong investment decisions (i.e. to invest more conservatively or to not invest at all until “things get better”). To highlight this fact, I went to the TIME magazine website and looked back 30 years for all the cover stories which illustrated worries (many of which warned of doom and gloom) about the economy or the stock market. I also looked at how much a $1,000 investment in the stock market*on the day the “doom and gloom”issue hit the stands, would be worth ten years later. I think you will find the results very interesting.
* To represent the stock market, I have chosen the Dow Jones Industrial Average which is one of the major indexes which aims to approximate the performance of the U.S. Stock Market


DOW JONES = 854.63
DOW JONES 10 years later = 1259.11
$1,000 invested in the Dow Jones on the day this issue hit the stands would have been worth $1,473 ten years later.


DOW JONES = 839.96
DOW JONES 10 years later = 1132.22
$1,000 invested in the Dow Jones on the day this issue hit the stands would have been worth $1,348 ten years later.


DOW JONES = 662.94
DOW JONES 10 years later = 1207.38
$1,000 invested in the Dow Jones on the day this issue hit the stands would have been worth $1,821 ten years later.
(almost doubling in 10 years)


DOW JONES = 579.94
DOW JONES 10 years later = 1163.21
$1,000 invested in the Dow Jones on the day this issue hit the stands would have been worth $2,006 ten years later.
(more than doubling in 10 years)


DOW JONES = 692.66
DOW JONES 10 years later = 1276.06
$1,000 invested in the Dow Jones on the day this issue hit the stands would have been worth $1,842 ten years later.
(almost doubling in 10 years)


DOW JONES = 772.44
DOW JONES 10 years later = 1958.22
$1,000 invested in the Dow Jones on the day this issue hit the stands would have been worth $2,535 ten years later.
(more than doubling in 10 years)


DOW JONES = 839.05
DOW JONES 10 years later = 2129.45
$1,000 invested in the Dow Jones on the day this issue hit the stands would have been worth $2,538 ten years later.
(more than doubling in 10 years)


DOW JONES = 834.04
DOW JONES 10 years later = 2440.06
$1,000 invested in the Dow Jones on the day this issue hit the stands would have been worth $2,926 ten years later.
(almost tripling in 10 years)


DOW JONES = 852.99
DOW JONES 10 years later = 2487.86
$1,000 invested in the Dow Jones on the day this issue hit the stands would have been worth $2,917 ten years later.
(almost tripling in 10 years)


DOW JONES = 885.41
DOW JONES 10 years later = 2732.36
$1,000 invested in the Dow Jones on the day this issue hit the stands would have been worth $3,086 ten years later.
(more than tripling in 10 years)


DOW JONES = 809.13
DOW JONES 10 years later = 2689.14
$1,000 invested in the Dow Jones on the day this issue hit the stands would have been worth $3,326 ten years later.
(more than tripling in 10 years)


DOW JONES = 977.99
DOW JONES 10 years later = 2909.90
$1,000 invested in the Dow Jones on the day this issue hit the stands would have been worth $2,975 ten years later.
(almost tripling in 10 years)


DOW JONES = 833.43
DOW JONES 10 years later = 3225.40
$1,000 invested in the Dow Jones on the day this issue hit the stands would have been worth $3,870 ten years later.
(almost quadrupling in 10 years)


DOW JONES = 860.92
DOW JONES 10 years later = 3369.41
$1,000 invested in the Dow Jones on the day this issue hit the stands would have been worth $3,914 ten years later.
(almost quadrupling in 10 years)


DOW JONES = 1165.20
DOW JONES 10 years later = 3832.30
$1,000 invested in the Dow Jones on the day this issue hit the stands would have been worth $3,229 ten years later.
(more than tripling in 10 years)


DOW JONES = 1182.42
DOW JONES 10 years later = 3745.62
$1,000 invested in the Dow Jones on the day this issue hit the stands would have been worth $3,168 ten years later.
(more than tripling in 10 years)


DOW JONES = 1805.31
DOW JONES 10 years later = 5532.59
$1,000 invested in the Dow Jones on the day this issue hit the stands would have been worth $3,065 ten years later.
(more than tripling in 10 years)


DOW JONES = 1892.29
DOW JONES 10 years later = 6219.82
$1,000 invested in the Dow Jones on the day this issue hit the stands would have been worth $3,287 ten years later.
(more than tripling in 10 years)


DOW JONES = 2014.09
DOW JONES 10 years later = 7442.08
$1,000 invested in the Dow Jones on the day this issue hit the stands would have been worth $3,695 ten years later
(more than tripling in 10 years)


DOW JONES = 2545.05
DOW JONES 10 years later = 10707.60
$1,000 invested in the Dow Jones on the day this issue hit the stands would have been worth $4,207 ten years later.
(more than quadrupling in 10 years)


DOW JONES = 3185.60
DOW JONES 10 years later = 9987.53
$1,000 invested in the Dow Jones on the day this issue hit the stands would have been worth $3,135 ten years later.
(more than tripling in 10 years)


DOW JONES = 3276.26
DOW JONES 10 years later = 7701.45
$1,000 invested in the Dow Jones on the day this issue hit the stands would have been worth $2,351
(more than doubling in 10 years)


DOW JONES = 7945.35
DOW JONES 10 years later = ???
DOW JONES on Aug 8th 2008 = 11,734


DOW JONES = 10621.35
DOW JONES 10 years later = ???
DOW JONES on Aug 8th 2008 = 11,734


DOW JONES = 9687.53
DOW JONES 10 years later = ???
DOW JONES on Aug 8th 2008 = 11,734


DOW JONES = 8920.70
DOW JONES 10 years later = ???
DOW JONES on Aug 8th 2008 = 11,734


DOW JONES = 12479.63
DOW JONES 10 years later = ???
DOW JONES on Aug 8th 2008 = 11,734


SUMMARY

On average, had you invested $1,000 on the day these issues hit the stand, the investment would have been worth $2,850 ten years later (almost tripling in that time)

At Dundee Private Investors Inc. we believe that having a financial plan forms the foundation necessary to grow, protect and transfer wealth from one generation to the next. We are committed to provide information on a variety of financial planning topics so our clients are able to make informed decisions.The information contained in this publication was obtained from sources believed to be reliable; however, DundeeWealth Inc., its affiliates, directors, officers, and officers or directors of its affiliates cannot guarantee its accuracy or completeness. This publication is for informational purposes only and should not solely be relied upon. Please consult your professional tax or legal advisor for advice related to your specific situation.

Friday, November 7, 2008

The Tax-Free Savings Account


Beginning in January 2009, Canadians will have a new tax-sheltered option for saving money, thanks to the new Tax-Free Savings Account (TFSA). Introduced by the federal government in their 2008 Budget, the TFSA will allow you to save or invest your money without having to pay tax on any income or capital gains. You can also withdraw funds tax-free at any time. That’s great news for Canadians, and a great incentive for you to save money and watch it grow faster than before – tax-free! This outline is based on the measures passed into law on June 18, 2008. As the January implementation of the TFSA draws nearer, more information will become available.

GETTING STARTED
The TFSA will be suitable for individuals of all income levels, whether you are just starting out or you have already accumulated substantial savings and investments. And it couldn’t be easier to set one up. Any Canadian resident who is 18 years of age or older and has filed a tax return will be able to establish a TFSA at DundeeWealth by completing the appropriate documentation once the TFSA officially becomes available in January 2009. Unlike a Registered Retirement Savings Plan (RRSP) or a Registered Educational Savings Plan (RESP), a TFSA is designed to help you save for any financial goal at any point in the future, for what matters most to you – a car, home renovations, starting a new business, a rainy day or retirement. You may even be able to use your TFSA assets as security for a loan.

CONTRIBUTIONS
Initially, your annual contribution room is $5,000 per calendar year. You will not have to contribute the maximum every year, as the unused contribution room can be carried forward to future years. This contribution room is in addition to any RRSP contribution limit you may have, but unlike an RRSP you won’t be able to deduct your TFSA contributions on your income tax return. In future years, the $5,000 annual contribution will be indexed to inflation in annual $500 increments. Unused contribution room will be carried forward indefinitely, and there is no limit to how much contribution room can be carried forward. You will be able to hold more than one account, but total contributions across all accounts cannot exceed your accumulated contribution room in any calendar year. If you do over-contribute, the Canada Revenue Agency will assess a 1% penalty for each month that excess contributions remain in your account.

WITHDRAWALS
You will be able to withdraw funds from your TFSA at any time, for any reason. Withdrawals will not be subject to taxes, so you can keep all that you have earned. The amount withdrawn during the year will be added to your unused contribution room the following year. So you don’t lose contribution room by withdrawing – you get it back in the following calendar year. Your contribution room for the next year will increase to reflect the amount of your withdrawal the previous year. You will also have the option to transfer your TFSA assets to your spouse or common-law partner upon death without any impact on the survivor’s existing contribution room.

ELIGIBLE INVESTMENTS
Most investments that can currently be held in an RRSP will also be eligible for your TFSA, including certain savings deposits, GICs, mutual funds, stocks and bonds.

INVESTMENT INCOME
Although TFSA contributions cannot be deducted from your income tax return, any earned income or capital gains will not be taxed. And money you take out of your TFSA won’t affect federal income-tested benefits and credits like Old Age Security, the Goods and Services Tax Credit and the Canada Child Tax Benefit. There’s a lot to like about the Tax Free Savings Account. As well as reducing taxes on savings and investment income, it offers income splitting opportunities and the ability to minimize social benefit clawbacks. Your Dundee Advisor can help you determine the best way to integrate it into your overall financial plan when it becomes available in January 2009.


At DundeeWealth, we believe that having a financial plan forms the foundation necessary to grow, protect and transfer wealth from one generation to the next. We are committed to provide information on a variety of financial planning topics so our clients are able to make informed decisions.
The information contained in this publication was obtained from sources believed to be reliable; however, DundeeWealth Inc., its affiliates, directors, officers, and officers or directors of its affiliates cannot guarantee its accuracy or completeness. This publication is for informational purposes only and should not solely be relied upon. Please consult your professional tax or legal advisor for advice related to your specific situation.
Dynamic Funds Market Commentary

Q&A with Rohit Sehgal, CFA
Chief Investment Strategist and Portfolio Manager


Equity markets have been under severe pressure over the past several months. How are you positioning the mutual funds you manage in the current environment?
On an on-going basis, we review our long-term strategy to ensure the funds are appropriately positioned. Over the past few months, global economic growth and equity market conditions have changed dramatically. Financial de-leveraging, paralysis in the credit markets, and fragile consumer confidence have combined to negatively impact both current and prospective global economic growth rates. Although we expect the concerted global stimulus package to eventually work its way into the real economy, it will take time. The economic and market reality has led us to change our long-term strategy by increasing sector diversification and capitalizing on selective opportunities in the US market. Despite the repositioning, we have not strayed from our growth discipline. The current market is simply providing us with growth opportunities in a different group of areas than what was previously available.

Is the bull market in commodities over?
I continue to believe in the long-term growth potential for commodities, particularly energy, and view the correction in commodity prices as merely a cyclical correction within the longer term secular growth story. The global economic slowdown is putting pressure on commodity prices, and although growth has moderated in the emerging markets it is still expected to be robust for a long period of time into the future. What is being forgotten in the current market environment is that long-term demand expectations for commodities remain healthy. Countries like India and China have to make huge capital investments in infrastructure, and growth in the emerging middle class will continue to impact demand. At the same time, supply constraints may become even more acute as uncertainty and lack of confidence in credit and equity markets have sidelined expansion projects. Recent research reports from the oil sector suggest that the combination of underinvestment on the supply side and long-term growth expectations on the demand side will necessitate massive supply side investments. For the long-term supply and demand relationship in the oil sector to remain in equilibrium, the supply side will have to make annual investments of hundreds of billions of dollars each year over the next 20 years. New investment is even more critical in light of the high annual decline rate of existing oil fields.

What changes have you made to the sector allocations and when did you begin to make the changes?
In this environment, with so much uncertainty, we felt it was prudent to incorporate a more balanced approach to sector exposure. We started to gradually make these changes three months ago and continue to make adjustments.

The portfolios you manage have been underweight financials for the past five years, why increase exposure now?

Since 2003, the most attractive growth stocks have resided in a fairly narrow set of sectors - energy, materials, industrials, and agriculture. Changing market conditions have allowed us to enter the financials sector, in the US and Canada, as a way to position the funds for above average future growth. We have outperformed over the long term by making early calls on growth sectors, and we feel the financial crisis in the US has provided an opportunity for the surviving companies. Although financials may not appear to be a growth sector at present, we believe the transformation of the global financial industry and continued consolidation will leave a handful of well-capitalized companies with the ability to increase market share and grow earnings.

The portfolios’ equity allocations are much more in-line with the S&P/TSX Composite Index now than they have been historically. Would you say that the portfolios resemble the index?
The portfolio decisions we make are independent of the index allocations. I do not look to the index for guidance and that should be very evident by our 40% exposure to foreign markets.

How is the foreign content allocated?
The foreign content is primarily in the US with exposure to financials, consumer staples, agriculture, and oil services companies.

Over the past several weeks, the Canadian dollar has depreciated significantly versus the US dollar. How has this impacted the portfolios’ US holdings?
The fall in the Canadian dollar has enhanced the return of our US positions. However, given the large move in the currency, we have now hedged half of the US dollar exposure.

You have increased exposure in consumer staples, are you looking at other defensive sectors such as utilities?
With valuations as low as they are across the market, we are looking for growth opportunities wherever they are available. With that in mind, we remain disciplined growth investors and will not buy stocks simply because they are cheap on a historical basis. The stocks we have bought in consumer staples have exceptional growth potential even within a slower growth economic environment. We have also found some strong US health care companies and increased exposure there as well.

Have you changed the asset allocation of Dynamic Power Balanced Fund?
For most of the past 12 months, the Fund had a higher allocation to fixed-income securities than equities. We have gradually moved to a more balanced allocation between the two asset classes. Given the dramatic market correction, we believe equity investments provide better long-term return potential than fixed-income securities and we will be making measured shifts to overweight the equity position.

Fund flows across the mutual fund industry have declined. Are the mutual funds you manage experiencing high redemptions?
We have had some redemptions in October, but overall we continue to receive positive flows. It is gratifying to see that investors have conviction in our ability to recover and I appreciate all the support.


Views expressed regarding a particular company, security, industry or market sector should not be considered an indication of trading intent of any funds managed by Goodman & Company, Investment Counsel Ltd. These views are not to be considered as investment advice nor should they be considered a recommendation to buy or sell.